Unlocking The Power Of Instagram Stories Analytics For Your Brand


Want More Real Instagram Followers?
Try Kicksta Now!Instagram is a key element of many business’s social media marketing strategies nowadays. And within recent years, Instagram Stories have become incredibly popular.
There are many Instagram users who barely even use the home feed anymore, instead choosing to consume Stories alone when they open the app. These short videos or static photos give a quick glimpse of content and then move forward, feeding into our short attention spans. If brands are skipping out on trying to use Instagram Stories, they’re missing a vital opportunity to connect with their audience.
Sure, they might still be successful on Instagram without it, but they could be even more successful if they added Stories to their marketing plan.
As with any marketing tactic, though, you need to be able to track and analyze your performance. Luckily, Instagram Analytics provides a whole section on Stories for business accounts.
Today we’re going to dive deep into Instagram Stories Analytics and how understanding and taking action on them can make a difference in your marketing strategy.
Quick Links
Why Instagram Stories Analytics Matter To Your Brand
Analytics are a crucial part of any marketing campaign. Without analytics, how will you know what content is resonating with your brand? Will you create more of what works and less of what doesn’t?
Can you try new types of content and feel confident incorporating them into your ongoing plan? Probably not.
Analytics allow you to make data-driven decisions for your brand. Your audience will tell you what they want to see from you. Sure, you could look for rules of thumb or trends, but your audience is unique to your brand.
The best way to be sure you’re creating and sharing the best content that they want to see is to monitor your analytics and make decisions based on what you find there.
Instagram Stories Insights can give you valuable feedback on your content. Stories have so many features that it can be fun to play with and add various stickers and engagement tools. But just because it’s fun for you and your marketing team doesn’t necessarily mean it resonates well with your audience.
Your analytics will show you which Story slides perform well, which ones people tapped through on, and which ones they spent the most time on. We’ll look more closely at that later. Brands aren’t the only ones who should rely on these insights, though. Influencers can improve their Instagram Stories game through this, too.
Getting Started With Instagram Stories Analytics
Now that you understand why Instagram Stories Analytics are important, let’s look closely at how to actually find and understand them in Instagram’s built-in analytics tool.
How To View Instagram Story Analytics: Step-by-Step Guide
First of all, make sure you have a business or creator account. If you’re still running your brand’s Instagram from a personal Instagram account, it’s time to make the switch. The analytics insights aren’t the only reason to switch to a business profile, but they’re potentially the most important ones.
Accessing these analytics is actually pretty easy. Begin by opening your Instagram profile, and then click on the hamburger menu in the top right corner.
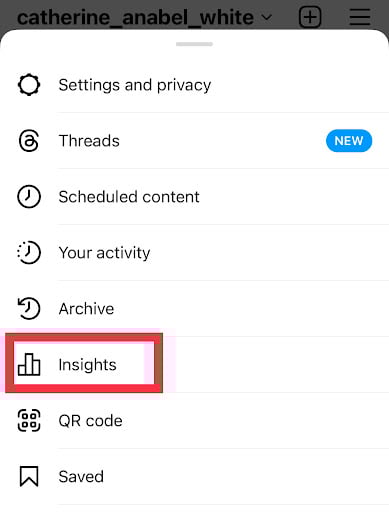
From there choose “Insights,” and then “Content You Shared.”
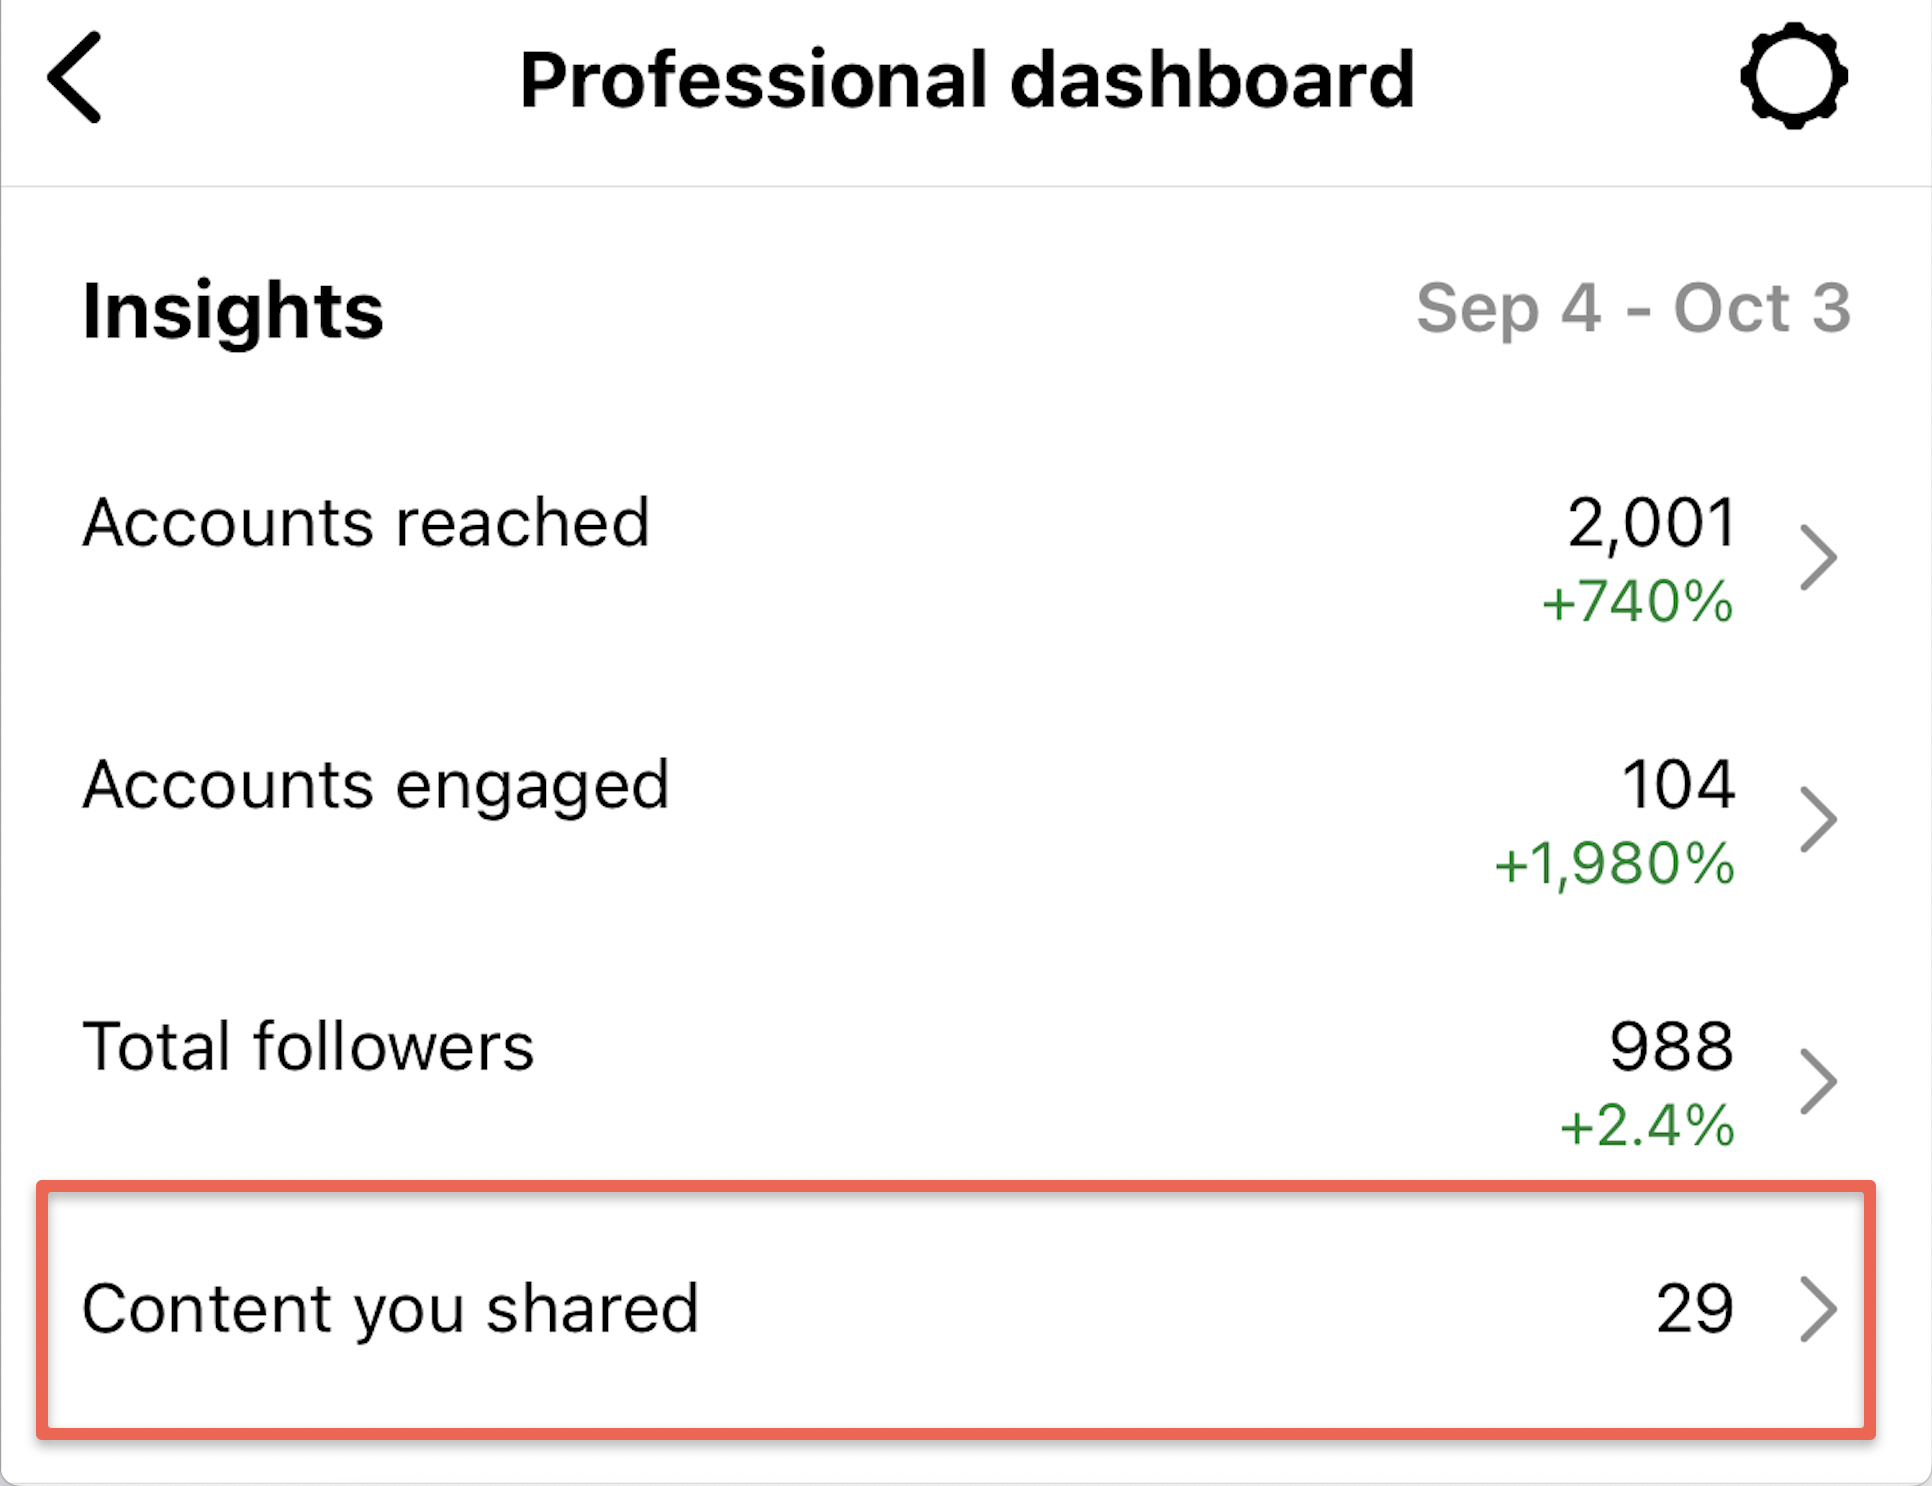
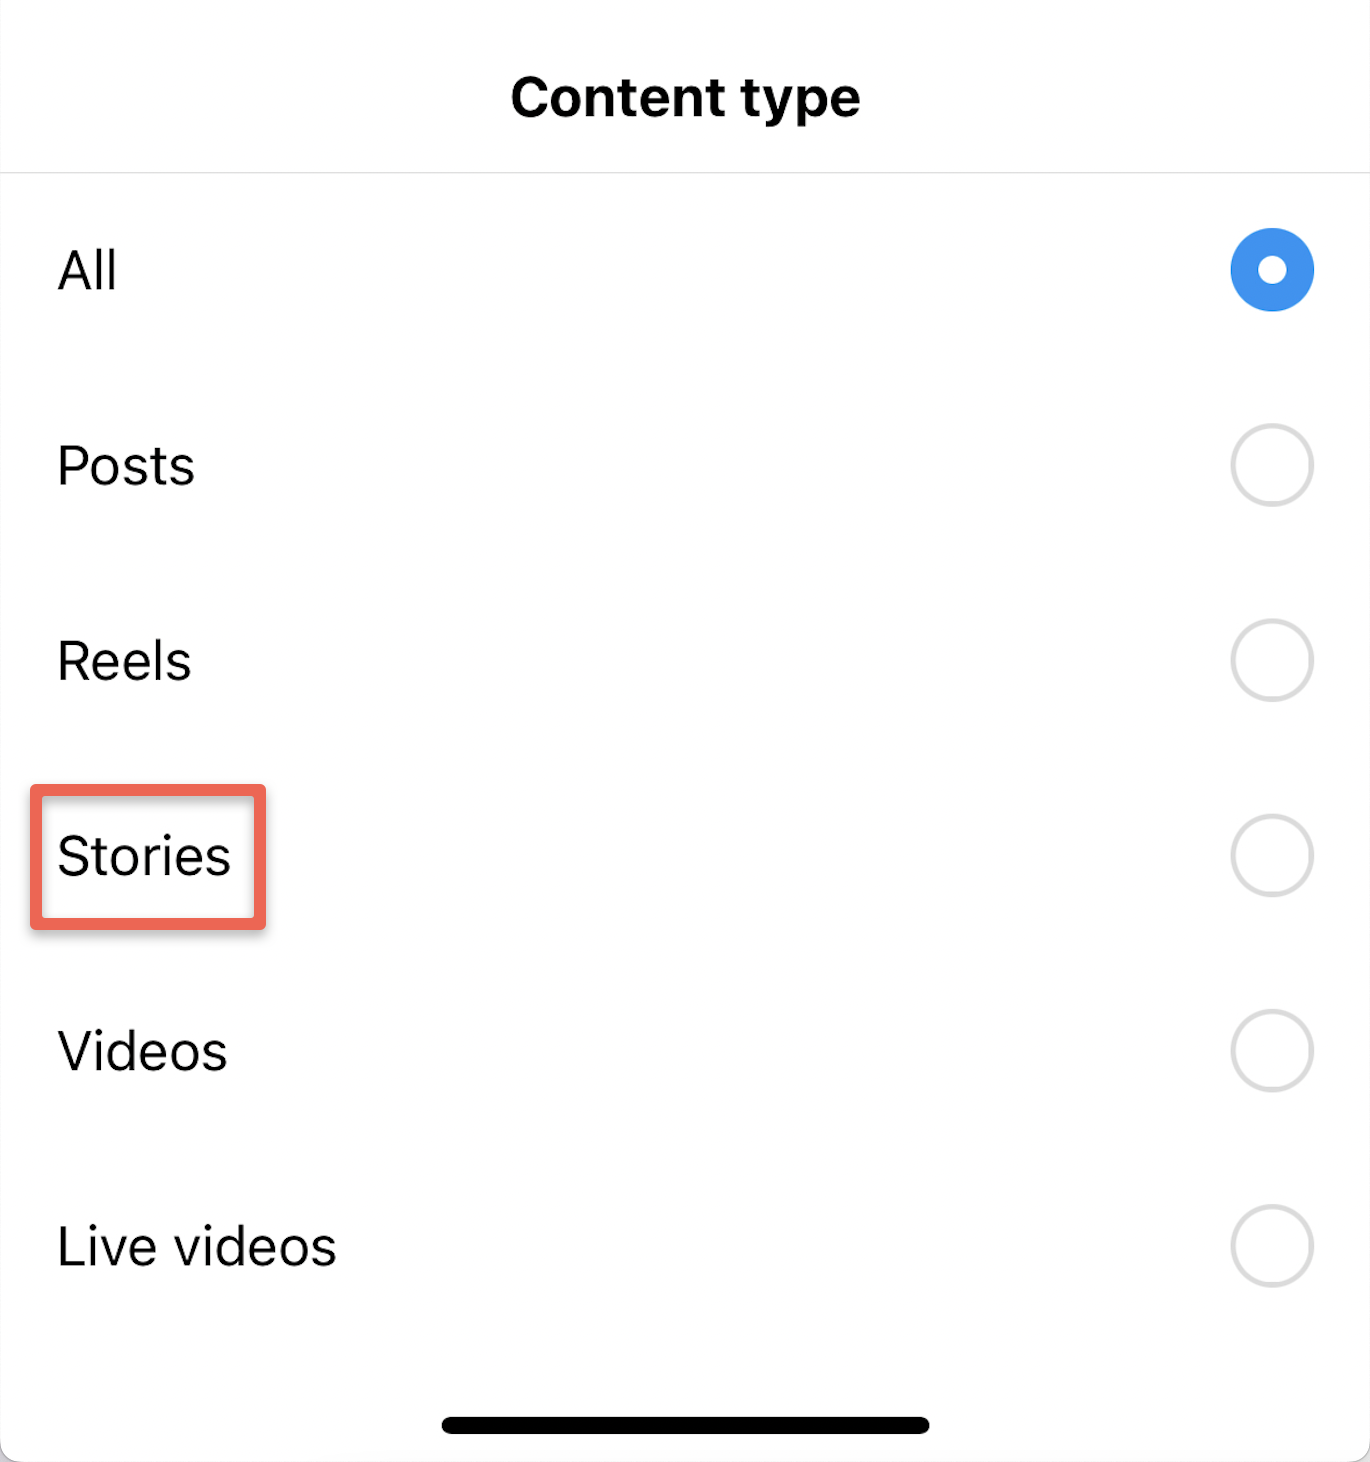
On that tab, you should see “Stories” as an option – tap that and you’ll be in business! You’ll be able to see each individual Story and see all the metrics and insights associated with it on that screen.
It’s important to note that you do need to have shared Stories in order to see them in this Analytics tab. If you know you’ve shared Stories recently and they aren’t showing up, check the timeframe you selected for your insights.
If you posted on Stories 10 days ago but have your analytics showing insights from the past week, it won’t appear.
Want to organically grow your Instagram and gain REAL followers?
Try Kicksta Today!Instagram Insights Dashboard Explained
If you haven’t been to your analytics dashboard in a while, here’s a little refresher on what you’re probably seeing.
Audience: you’ll see your follower breakdown, growth, locations of your audience, gender breakdown, age range, and active times. All of this is important to your Instagram success.
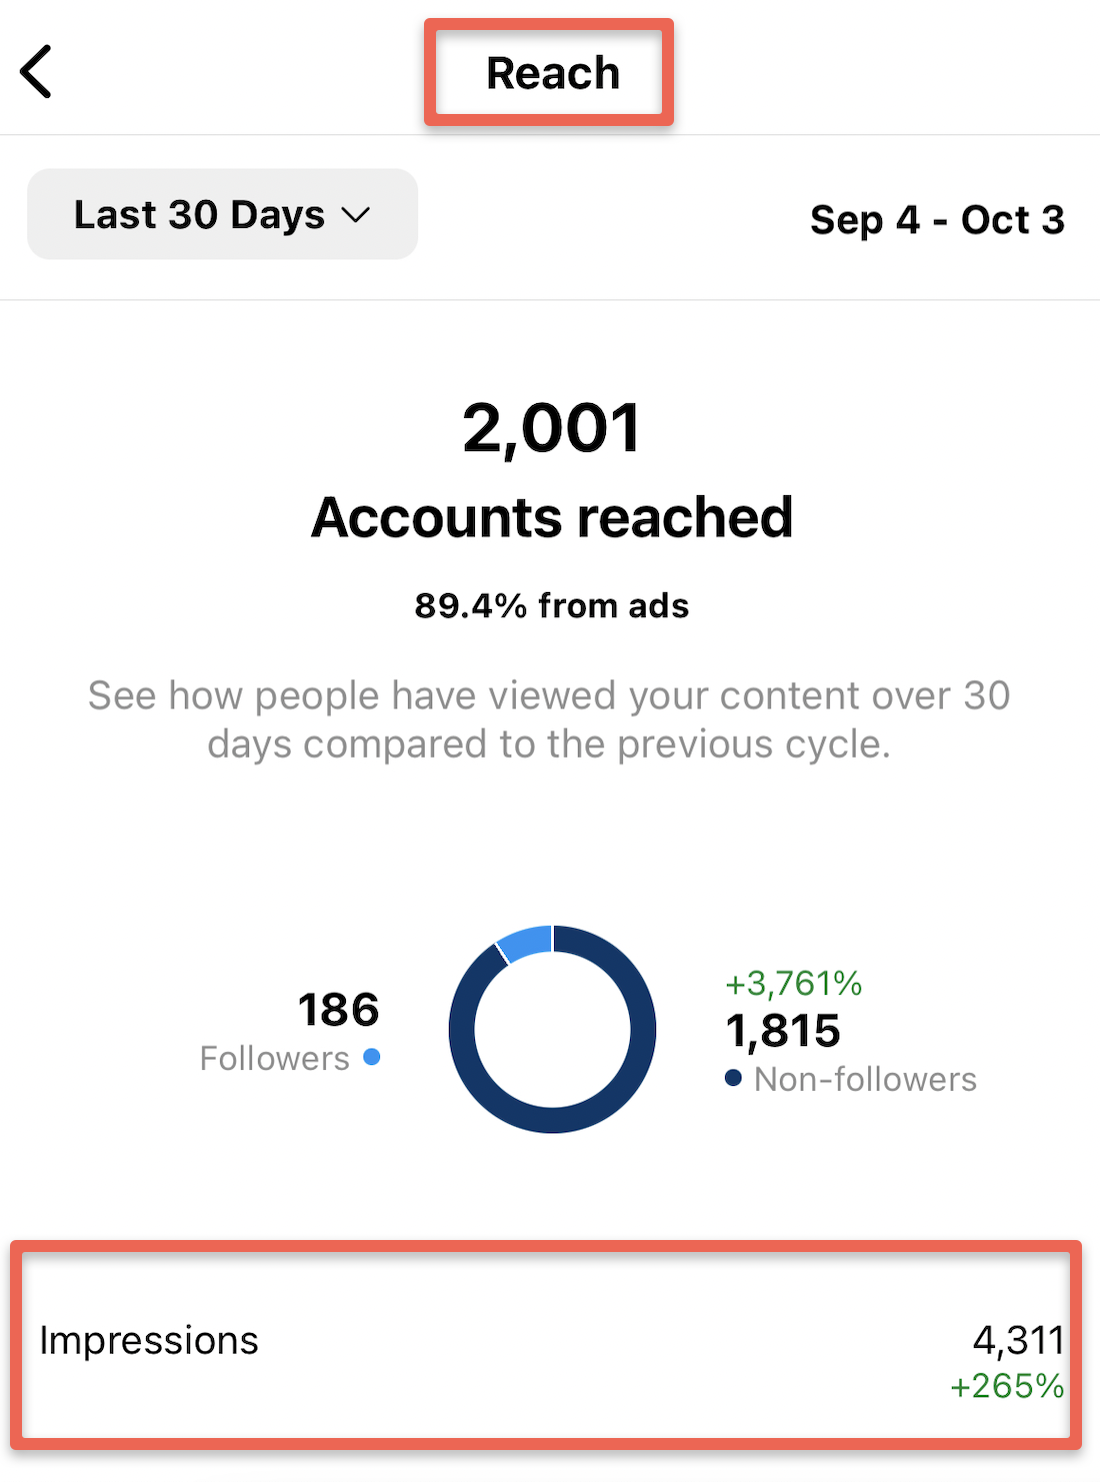
Reach: you’ll see how many accounts your posts reached, impressions generated, and activity on your profile.
Content: you’ll see each of your posts, Reels, and Stories and the analytics related to them. This includes your views, engagement, and more.
Key Story Metrics To Watch Out For
Once you get to the Stories section of your Insights, there are a few types of metrics you’ll see. Primarily, you’ll see Discovery, Navigation, and Interaction.
Each of these categories contains multiple insights that measure a variety of information. You’ll need to review and understand all of them to make the most of your analytics, but starting off small is always a good idea.
Let’s look closely at each of these metrics you’ll see when analyzing your Instagram Stories performance.
Discovery Metrics
- Reach: Reach tells you the number of unique accounts that saw your Story slide.
- Impressions: Impressions measure how many times your Story slide was seen. This includes people who viewed your Story multiple times.
Discovery metrics are important because they let you know how much exposure your Instagram Stories are getting. These brand awareness insights are the baseline of all your metrics. If you’re only getting a few accounts to see your Stories, you should begin by improving your Story reach and impression, especially to your target audience.
The rest of the metrics can come later.
Navigation Metrics
- Forward Taps: This is self-explanatory. This tells you the number of people who tapped forward to your next Story slide.
- Back Taps: Also self-explanatory, this tells you how many people tapped backward to your previous Story slide.
- Next Story Swipes: Sometimes instead of tapping forward to your next slide, they’ll swipe forward to reach the next account’s Story. This metric shows you how many users did that.
- Last Story Swipes: Similarly, this metric shows how many users swiped backward to reach the previous Story.
These navigation metrics are critical to understanding how well your Stories are resonating with your audience. They’ll show you how people are consuming your Stories.
If everyone is tapping through or swiping away, it might show you that they’re not overly interested in the type of content you’re posting on your Stories. We’ll talk more about interpreting these analytics later.
Interaction Metrics
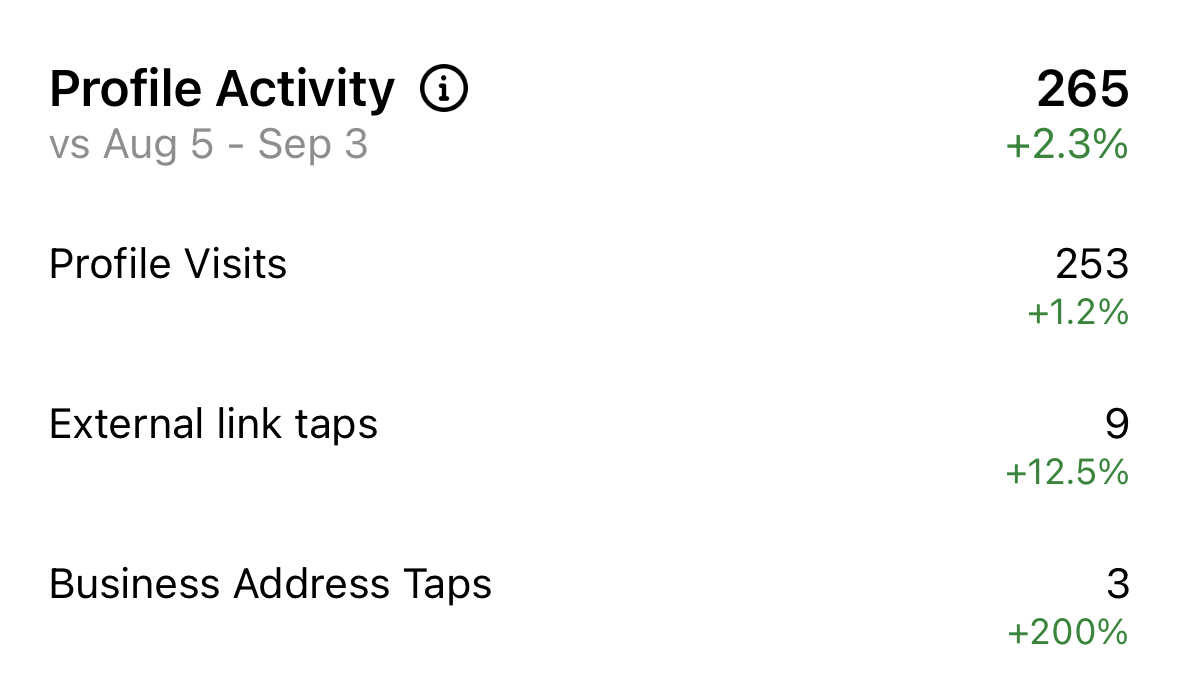
- Profile Visits: This tells you how many people tapped on your username and visited your profile from your Story.
- Replies: This tells you how many users replied to your Stories.
- Follows: This metric shows how many people followed you from your Stories.
- Shares: The Shares metric shows how many people shared a particular Story slide with someone via a Direct Message or other method.
- Website Visits: This metric tells you the number of times users clicked on a link in your Story.
- Sticker Taps: If you put stickers on your Story, this is where you’ll see how many people tapped on it.
- Calls, Text, Emails: This shows you how many users contacted you through a call, text, or email.
- Product Page Views Per Product Tag: If you added product tags to your Story, this metric will show you how many times the corresponding product pages were viewed.
- Interactions: This metric shows how many times anyone interacted with your Story, including liking it.
Interaction is the background of Instagram. The algorithm tends to favor posts that receive more interactions. Brands and Creators can learn from and engage with their audience through interactions. Once your Stories reach enough people and they’re watching your content for long enough, you can focus on improving your interactions.
- 🤩
- 🤙
- 🤑
Join 100k+ savvy Instagram marketers
If you are struggling to get the attention you deserve on Instagram, sign up for Kicksta today and start attracting more followers who are interested in your brand.
Analyzing Data From Instagram Stories To Improve Your Brand’s Content Strategy
Once you’ve reviewed and gathered your metrics, it’s important to analyze it well. Instagram will give you raw data, but you’ll need to take the time to understand how this information can be used to inform your Instagram strategy. All of these metrics are important, but some have more weight than others.
Let’s take a closer look.
Reach vs. Impressions: Which Is Better?
This isn’t necessarily a question of which is better, but how you can compare the two. If your impressions are higher than your reach, it means your content is resonating with your audience and they’re viewing your Instagram Stories multiple times.
This likely means the type of content you’re creating is important and beneficial to them.
On the other hand, if your reach is higher than your impressions, it means your Stories are being seen by more people. Depending on some of your other metrics, it could mean your audience is sharing your Stories with their friends.
If your share is low, though, having high reach but low impressions or low reach overall could mean that your audience isn’t interested in seeing your Stories.
If that’s the case, you’ll need to make some changes to bring them back.
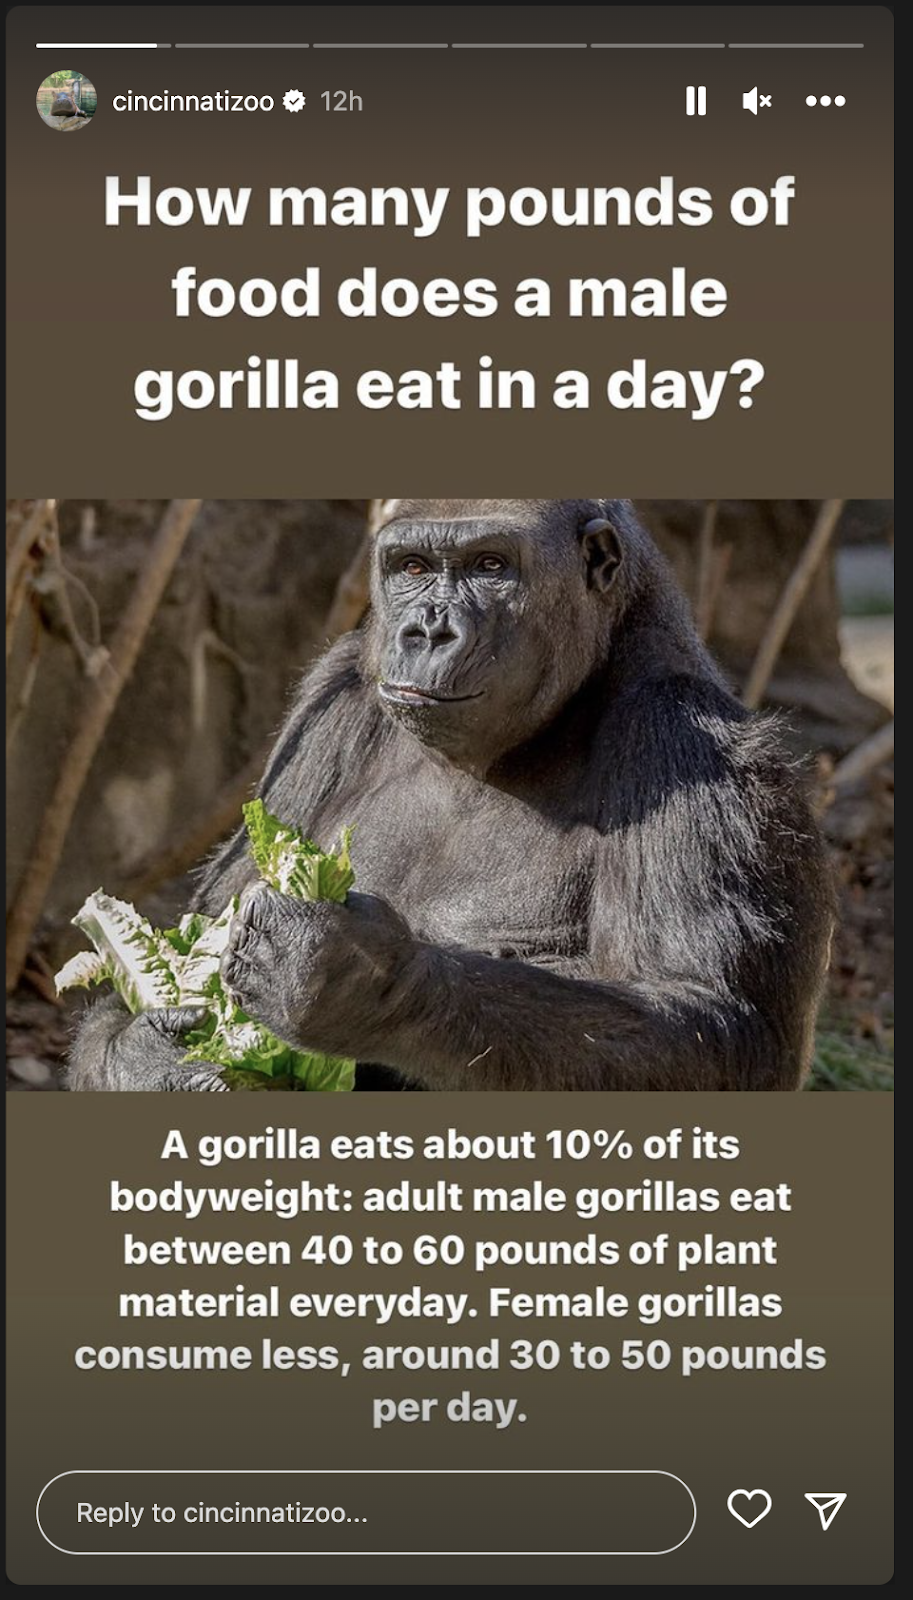
Sometimes the best kinds of Stories contain fun facts, like this one from the Cincinnati Zoo. Although it might not have a clear call to action, something like this is likely to make people want to share it with their friends.
Taps Back vs. Taps Forward: Which Is Better?
This one is a simple one: taps back are better than taps forward…most of the time. Taps back mean people are so interested in one of your Story slides that not only did they watch it once, but they tapped backward to be able to watch it again.
This gives you great insight into what kind of content your audience likes and what you should create more of in the future.
Taps forward aren’t great because they mean your audience is ready to click on the next slide. However, if your Instagram Story is a static image with little to no text (so it wouldn’t take very long to read it), your audience might not be bored with your content but rather eager to see the next thing.
Attention spans are very, very short in 2023. If someone has already consumed everything they can from a piece of content, they likely won’t stick around patiently for another eight seconds until the Story expires on its own.
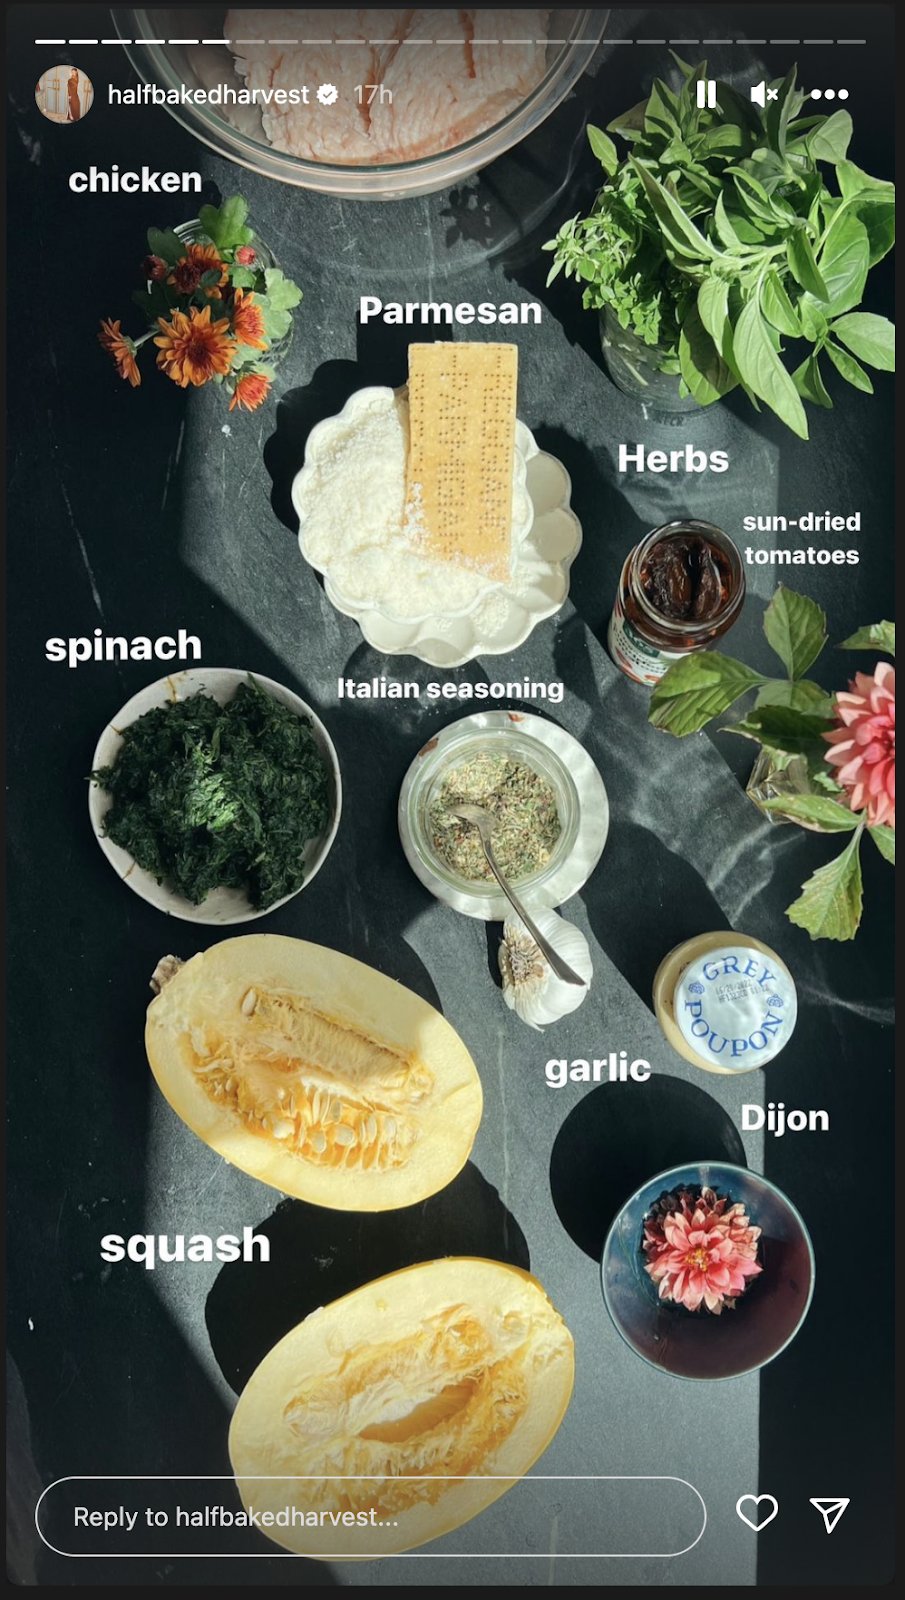
Half-Baked Harvest is a popular food Instagram channel. Their Stories often contain recipes, and with a slide like this, there are likely many people tapping back to be able to write down their list of ingredients before they move on to the rest of the recipe.
Tracking Stories You’re Tagged In
It’s always important to keep an eye on the Stories you’re being tagged in across Instagram. This shows you how your audience is talking about you on their platforms.
We’ve made it clear that Stories are very popular on Instagram, and that doesn’t just mean for brands. Individual user’s Stories are also performing well, so if someone is talking about you in their Story, that’s as valuable as having them mention you in one of their feed posts.
Many Instagram giveaways now require or offer bonus entries for people who share the giveaway post to their Story and tag the account. This can help you increase the reach of your account, potentially to people who have never heard of your brand.
If you can find a way to keep track of people who mention you in their Stories regularly, you could always share their Story slide to your Stories and tag them as a thank-you.
Cozy blanket brand Minky Couture reposts when people write about getting or loving their blankets and tagging the brand in their Stories. This gives Minky Couture great content to share while also providing them with social credibility thanks to these promoters.

Want to organically grow your Instagram and gain REAL followers?
Try Kicksta Today!Measuring Traffic From Stories
This is where your Interaction metrics come into play. Stories are very popular currently, but they hold extra weight if they drive people to visit your profile or your website, or if they visit a product page through a product tag.
When you add tags and links to your Stories, you’re giving people a chance to do more than just consume your content and instead engage with your brand in a meaningful way. Measure your link clicks and see how many conversions your Stories will generate.
Monitor these metrics carefully and come up with new and exciting ways to encourage your audience to interact with you. Engagement stickers like polls and question boxes are great, but so are links to your website and product tags.
These types of engagement are deeper, though, so don’t be discouraged if you see less engagement than you do with simple polls and questions, especially when you first begin using them.
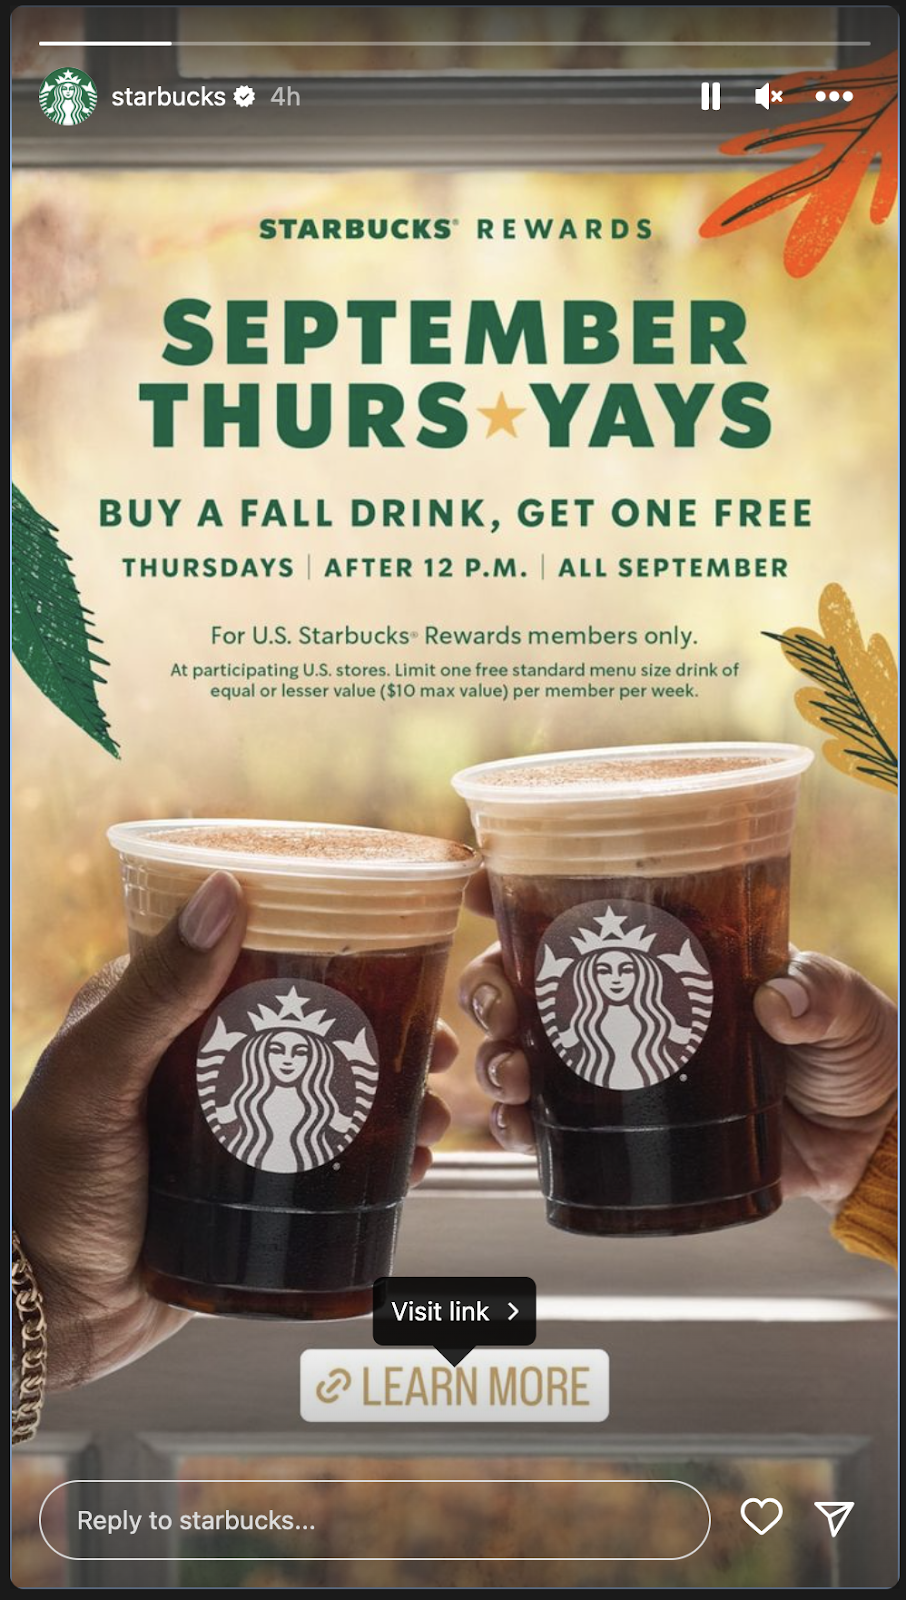
Starbucks offers a link to learn more about their Thursday deals in the month of September, but honestly, the copy on their link could be a little more creative.
They’re a massive brand, though, and probably don’t really need to convince their audience to click the link. If you’re just getting started with links, though, consider adding catchy or clever copy to encourage people to click.
Measuring Hashtag & Location Stickers
If you add hashtags or location stickers to your Stories, you can see how many times people tapped on them. Simply go into your Insights and to the Story slide that contained the sticker. Then look at the “Sticker Taps” metric and see how many people hit it.
By watching the performance of these stickers, you can understand what your audience is eager to engage with, and you can strategically place them on future Stories.
The location stickers are especially helpful if you have a brick-and-mortar business. If you’re trying to drive people into your actual store or shop, or if you provide deliveries only to a certain area, location stickers can help you understand who from your audience is located in the right area for you.
Final Thoughts
Before we wrap up, there’s one more piece of advice to share. As you begin to track your analytics and insights, it’s important to log this information somewhere so you can refer to it.
The beauty of analytics is that they’re always changing. What worked yesterday might not work in two weeks. When you have historical data at your fingertips to compare and learn from, you’ll be able to make strong, data-driven decisions to optimize your Instagram Stories, which will help improve your brand strategy overall.
Now that you know the ins and outs of Instagram Stories Analytics, it’s time for you to get started.
Post some Stories and then look at your metrics the next day. Experiment with different kinds of content and see what your audience resonates with. It might be different from what they like to see in your feed posts, so try out different things.
Try out swapping the color of your Instagram Story background. Use a wild font that you’ve never tried before. Try a trend. Have some fun and see what resonates with your audience.
Then refer back to your Instagram Stories metrics and see what information you learn. Turn that into a well-rounded, data-driven Instagram Stories strategy and see how well your Stories work for you.
Instagram Growth Hacks
Join over 100k+ marketers and influencers who get the latest Instagram tips & tricks sent to their inbox every week